Without a Comparison Group Why is COVID A Problem?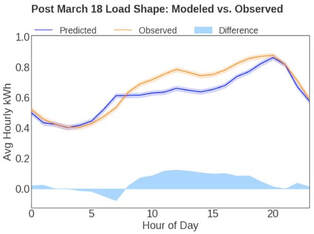 Residential Sector COVID Impacts: Blue line is CalTRACK Hourly Counterfactual. Orange line is observed usage. Without a comparison group to account for COVID, the increase in consumption wipes out program savings. Chart Shows Analysis from March 19 - May 8; 7.2% Increase in consumption due to COVID Diff-of-Diff: A (Slightly) Deeper DiveThe “Difference of Differences” Calculation
(Counterfactual_Treatment - Observed_Treatment) - (Counterfactual_Comparison - Observed_Comparison) Video of the August 14, 2020 Meeting: Comparison WG VIDEO - 2020-08-14 Slides from the August 14, 2020 Meeting (cumulative): Comparison WG SLIDES - 2020-08-14 Chat Record from the August 14, 2020 Meeting: Comparison WG Chat - 2020-08-14
0 Comments
Leave a Reply. |
Archives
March 2024
Categories |
 RSS Feed
|
©2020 Recurve Analytics Inc. "Recurve" is a trademark of Recurve Analytics Inc. All rights reserved.
Privacy Policy. Terms of Service. |

|