|
GRIDmeter™ Methodological Overview
This GRIDmeter report describes methods for:
In the guidance that follows, many of the concepts of comparison group methodologies will seem familiar. |
| ||||||||||||||||||
|
However, the particular use case is distinct from the multifaceted objectives of final program evaluations. The ‘in-flight’ comparison groups described here are designed to support population-level programs measured at the meter in the normal course of program operation. Many emerging programs also utilize pay for performance structures in which whole-building meter-based savings calculations aggregated across a portfolio of projects inform an aggregator payment directly. As such, both the requirements and the embedded assumptions about the purposes of a comparison group will differ from what is found in UMP Chapter 8 and other similar program evaluation protocols.
|
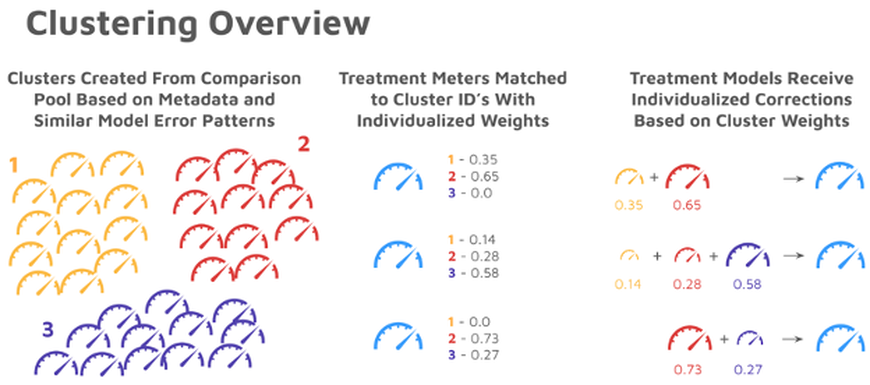
GRIDmeter represents a major advancement toward accurately measuring the net impact of these meter-based pay-for-performance programs, which can include virtual power plants, demand response, energy efficiency, controllable devices, and other demand-side energy initiatives. GRIDmeter comparison methods utilizes a suite of machine learning tools, including clustering algorithms, to enable significantly more robust measurement of net grid impact for portfolios and individual sites.
GRIDmeter advances the state of the art for demand side resource measurement:
GRIDmeter advances the state of the art for demand side resource measurement:
- Minimizes important differences between a treated site and its comparison group.
- Conducts matching using hourly model error rather than consumption.
- Applied to individual sites and aggregated to portfolios.
- Improves measurement stability by better utilizing the full comparison pool.
- In Recurve’s implementation, uncertainty is computed for any slice of results.
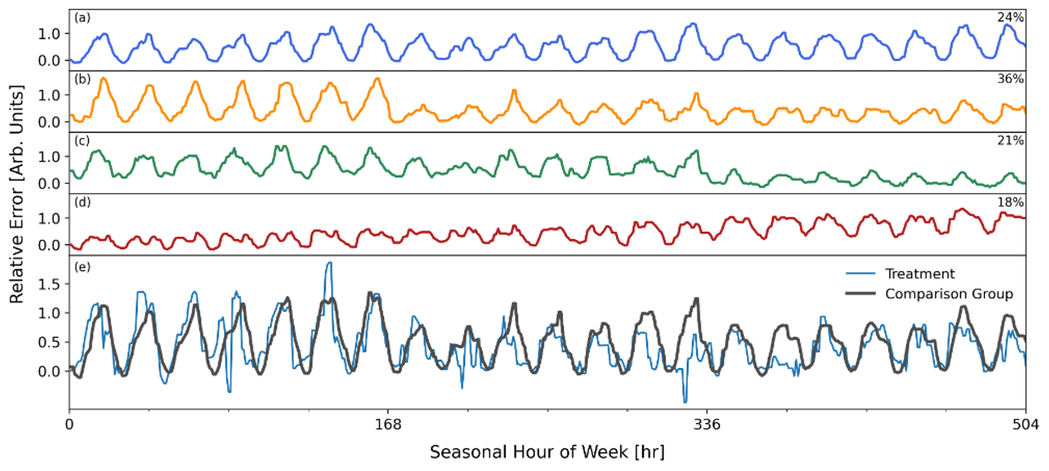
The next image gives an example of GRIDmeter matching. A treatment meter’s model error profile (bottom panel) is matched by a weighted combination of clusters (top four panels). With the combination of clusters in place that best replicates the treatment meter’s baseline error profile, the comparison group corrections in the post-program period will have the greatest relevance. This process is done for every meter in the treatment group.
The GRIDmeter approach has several key advantages:
The GRIDmeter methods are now available through the open-source GRIDmeter repository and to all Recurve customers.
- ML Clustering harnesses the full statistical power of the non-participant pool. With all suitable meters selected into a cluster, the comparison group takes advantage of the maximum statistical power available in the comparison pool. This trait of ML Clustering also mitigates the need for an evaluator to balance the size of the comparison group against the need for accurate load-shape matching, a tricky step that often requires judgment calls and is limited by the number of non-participants available.
- Clusters provide more stable and individualized comparison group corrections. In ML Clustering, every participant is given an individualized correction that depends on the trends observed in the unique weighted combination of clusters assigned to it. The individualized correction is far better for additional analyses that utilize meter-level results. In other comparison group methods, changing the composition of the participant sample will change the composition of a comparison group. In Individual Meter Matching, for example, adding a participant will add non-participant meters to the comparison group, thus changing the project results.
- Clusters are formed based on model error profiles, which are directly aligned with the goal of a comparison group. Comparison groups are intended to isolate and remove model errors. By formulating clusters based on baseline period model error profiles, matching can then be done on the metric that best reflects the ability of a comparison group to accomplish its objective. For instance, a participant who experienced a 25% reduction in consumption during the COVID period will exhibit a model error profile that reflects this change. That participant will be matched to clusters that best emulate that pattern. Many other selection methods focus on consumption or load shape matching, which are often correlated but ancillary to the main objective of the comparison group.
The GRIDmeter methods are now available through the open-source GRIDmeter repository and to all Recurve customers.
|
Acknowledgments
This report was developed based upon funding from the Alliance for Sustainable Energy, LLC, Managing, and Operating Contractor for the National Renewable Energy Laboratory for the U.S. Department of Energy. Recurve would also like to thank MCE for supporting this project by providing secure access to data. Without secure data-sharing partnerships between utilities/energy providers and the demand side service industry, the next generation of programs capable of fighting climate change, enhancing grid resilience, keeping rates affordable, and meeting customer needs simply cannot be developed. MCE’s partnership in this effort shows it is serious about solving these issues and helping others do their part. Finally, Recurve thanks the members of the Comparison Groups Working Group, who devoted their time and effort to listening, reviewing, and providing feedback throughout the research and development of the methods and recommendations in this report. Through nearly a dozen working group meetings and outside engagement, the working group members helped focus our efforts and ensure a final product that we believe can genuinely help the industry as we continue to address COVID and seek to modernize demand-side programs. |


