GRIDmeter
  • GRIDmeter™
  • Methods
    • GRIDmeter
    • FLEXmeter
  • Code
  • Blog

caltrack review: june 05, 2020

8/18/2020

0 Comments


key concepts regarding metered savings
Picture
  • Assumption: There is a singular event in a building that marks the beginning of a new pattern of energy consumption.
  • We want to be able to calculate the difference between this new pattern of energy use and the energy use that would have occurred if the old pattern was still in place.


  • Confusing term: baseline
    • Baseline can refer to the chronological time frame corresponding to the historical energy consumption of a building. For example, we might say “12 month baseline” and refer to the time period prior to the new pattern of energy use.
    • Baseline can also refer to the “counterfactual.” This is the estimate of how much energy would have been consumed at any given point if no changes had occurred in the building’s energy use pattern. For example, when we calculate savings, we subtract actual energy use from “baseline” energy use. In this case, we are subtracting from a calculated counterfactual rather than the actual historical consumption.
  • Confusing term: normalize

    • Statistical term versus a weather term


  • In California, the policy term of art used to describe meter-based programs is NMEC - Normalized Metered Energy Consumption.
  • Normalized (statistical)
    • Identification of a key predictive factor that correlates well with changes in energy consumption
      • Outdoor weather conditions (dry bulb temp, wet bulb temp, wind, cloud cover)
      • Indoor conditions (occupancy, production, certain end uses)
    • What is the minimum set of data that we have available across all buildings that will allow for consistent, replicable analysis?
      • Outdoor temperature (dry bulb)
      • Indoor building state (occupied/unoccupied by inference)

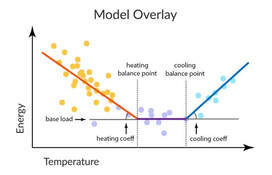
    • Normalization means that we use a particular set of exogenous conditions to calculate a counterfactual energy consumption value
      • E.g., When the daily average temperature is 80, this building will use 27 kWh of electricity on average.

Video of the June 05, 2020 Meeting: Comparison WG VIDEO - 2020-06-05

Slides from the June 05, 2020 Meeting (cumulative): Comparison WG SLIDES - 2020-06-05

Chat Record from the June 05, 2020 Meeting: Comparison WG Chat - 2020-06-05


0 Comments


Leave a Reply.

    Archives

    December 2020
    October 2020
    September 2020
    August 2020

    Categories

    All

    RSS Feed


Contact the Project Team
©2020 Recurve Analytics Inc. "Recurve" is a trademark of Recurve Analytics Inc. All rights reserved.
​Privacy Policy. Terms of Service.
Picture
  • GRIDmeter™
  • Methods
    • GRIDmeter
    • FLEXmeter
  • Code
  • Blog