GRIDmeter
  • GRIDmeter™
  • Methods
    • GRIDmeter
    • FLEXmeter
  • Code
  • Blog

How Stable are Comparison Groups over Time?

8/31/2020

1 Comment

 
Picture
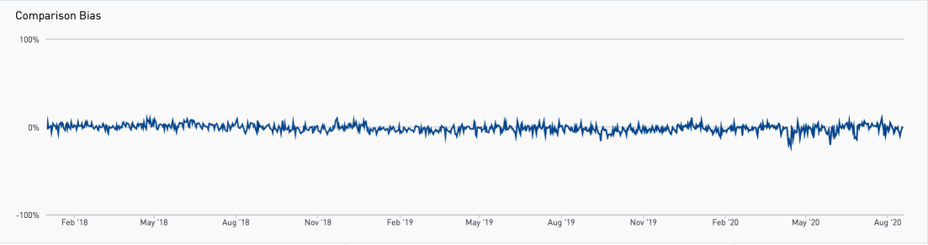
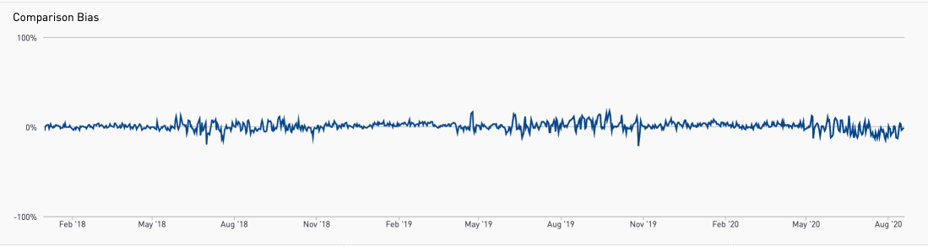
●Would a comparison group that matches the baseline usage pattern of a treatment group start to exhibit bias over time that would negate some of the savings of the treatment group?
●We know that there might be self-selection issues that might need to be addressed during the selection of the comparison group
●But we don’t know what the variability of the bias might be and we don’t know whether or not it might get worse under conditions of large-scale energy changes, such as during COVID

experiment

●Simulate the selection of treatment and comparison groups for a program
●Target a subset of high peak load users, similar to what might done for a program that is focused on peak load reduction
●Select a variety of sizes of “treatment” and “comparison” groups from the larger targeted population that can be compared against each other

pure doppelganger   vs   two smallest groups   vs   two largest groups

Picture
Picture
Picture

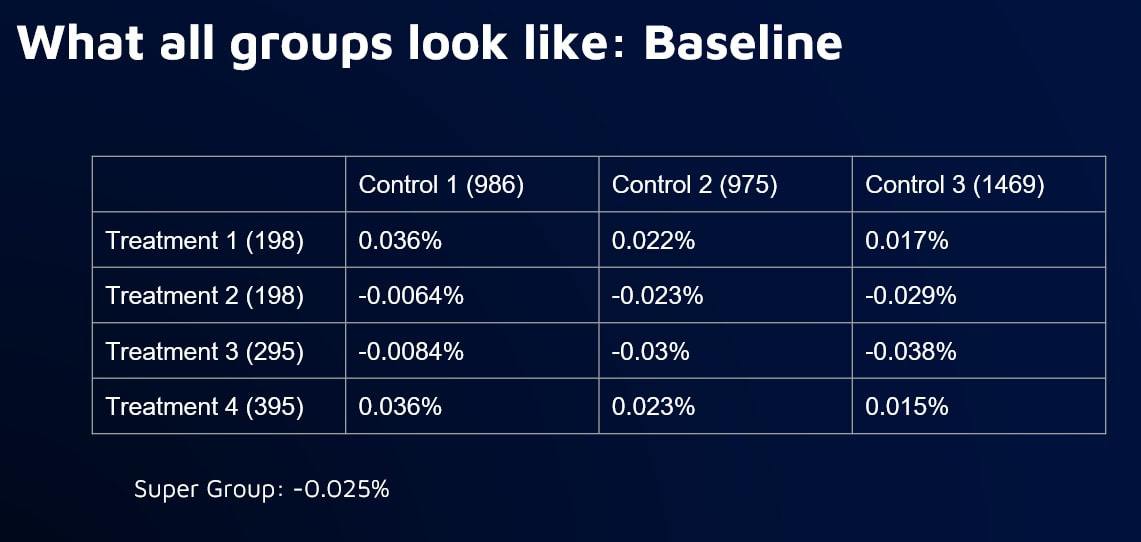
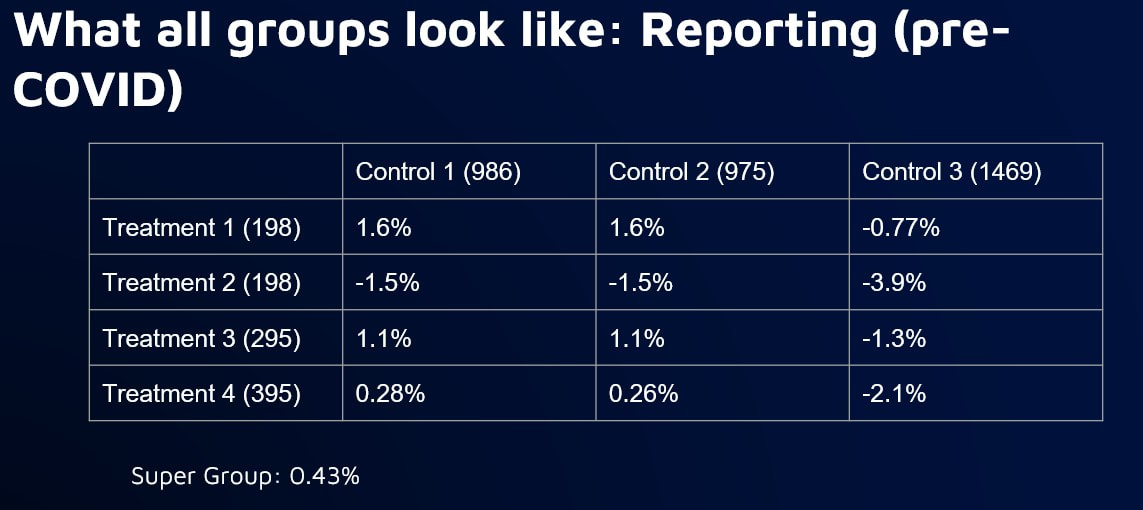
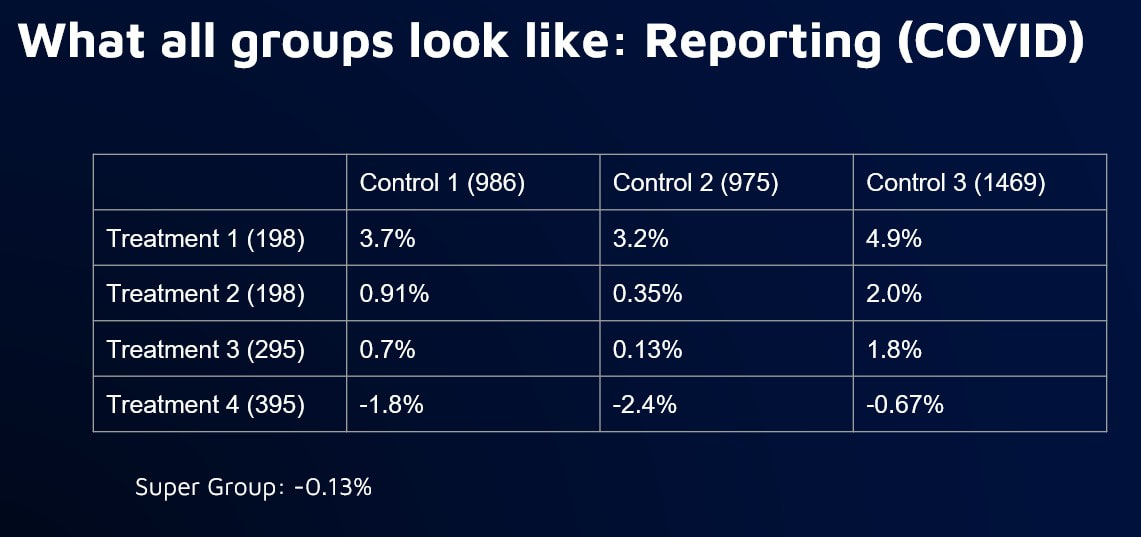
takeaways:

 Bias is inevitable in comparison groups due to factors beyond our ability to control for

2) Larger groups will reduce bias, but treatment group may still diverge from comparison group over time

3) Need for more systematic approach to determine optimal comparison and treatment group sizes

Standardizing Stratification

Picture
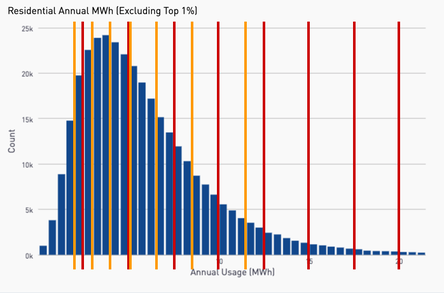
Stratification is about binning

●What parameters?
●Equal distance or population?
●How many bins?
●How many parameters?
●In what order of priority?
●Should there be an order?
●How do you gauge success?


Stratified Sampling: What are the Constraints?
The only option in resampling is the elimination of meters.

Two main constraints:

1.The size of the comparison pool
2.The number of meters needed in the final sample

Picture
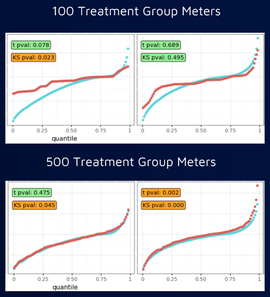
Standardizing Stratification: Dealing with Multiple Parameters

Multiple parameters can generate a more representative sample

●Complexity: Stratifying the first parameter and then moving on to the next will inherently change the first
               ○Solution = Simultaneous 2D or nD binning
●How should the individual parameters be prioritized and binned?
               ○Solution = An optimal scheme should be determined via                    algorithm.
●How do you gauge success?


Video of the August 28, 2020 Meeting: Comparison WG VIDEO - 2020-08-28
Slides from the August 28, 2020 Meeting (cumulative): Comparison WG SLIDES - 2020-08-28
Chat Record from the August 28, 2020 Meeting: Comparison WG Chat - 2020-08-28

1 Comment

exploring stratified sampling: august 14, 2020

8/18/2020

0 Comments


Without a Comparison Group Why is COVID A Problem?

Picture
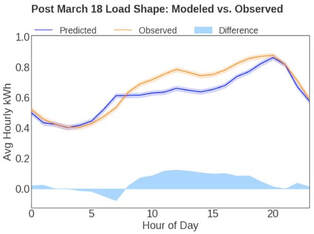
Residential Sector COVID Impacts:

Blue line is CalTRACK Hourly Counterfactual. Orange line is observed usage.

Without a comparison group to account for COVID, the increase in consumption wipes out program savings.

Chart Shows Analysis from March 19 - May 8; 7.2% Increase in consumption due to COVID

Diff-of-Diff: A (Slightly) Deeper Dive

The “Difference of Differences” Calculation

  • Step 1: Create baseline period model for treatment group and project that model as a counterfactual into the reporting period (Counterfactual_Treatment)
  • Step 2: Create baseline period model for comparison group and project forward as a counterfactual (Counterfactual_Comparison)
  • Step 3: Calculate savings as:

Savings = 
(Counterfactual_Treatment - Observed_Treatment) - (Counterfactual_Comparison - Observed_Comparison)

Video of the August 14, 2020 Meeting: Comparison WG VIDEO - 2020-08-14

Slides from the August 14, 2020 Meeting (cumulative): Comparison WG SLIDES - 2020-08-14

Chat Record from the August 14, 2020 Meeting: Comparison WG Chat - 2020-08-14

0 Comments

exploring stratified sampling: July 31, 2020

8/18/2020

0 Comments


concept

  • Match the distribution of a feature in one group to another by selective sampling.
  • In our case we sample from a comparison pool to form a comparison group in which the distributions of one or more key consumption parameters are statistically matched to a treatment group. 

Stratifying a sample is done based on binning: Bins are defined based on the treatment group. The relative number of customers between treatment and comparison groups needs to match in every bin.
Picture

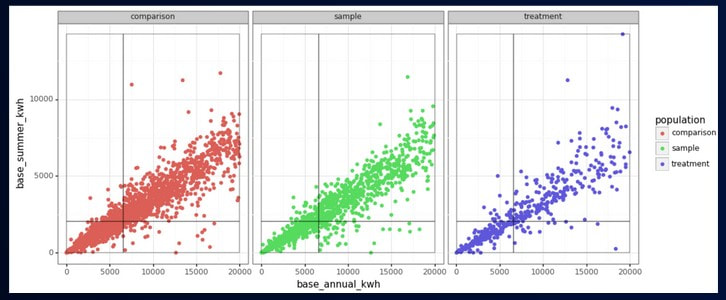
anticipated strategy

For most comparison pools, stratify on up to 3 parameters
  1. Annual Consumption
  2. Percent usage change from COVID
  3. 3. A parameter of relevance to the program (likely a normalized metric)

Examples of normalized electric features

% Heating kWh

% Baseload kWh

% Summer Peak kWh

Video of the July 31, 2020 Meeting: Comparison WG VIDEO - 2020-07-31
Slides from the July 31, 2020 Meeting (cumulative): Comparison WG SLIDES - 2020-07-31
Chat Record from the July 31, 2020 Meeting: Comparison WG Chat - 2020-07-31


0 Comments

testing stratified sampling: july 17, 2020

8/18/2020

1 Comment


key research strategy

Create “Treatment” groups by selecting unique samples of customers

Stratified sampling to produce Comparison groups

Monitor divergence between “Treatment” and Comparison Groups (both pre- and post-COVID

These “Treatment” groups are not program participants (which is good)!

phase 1: stratified sampling and pre-covid testing

Picture
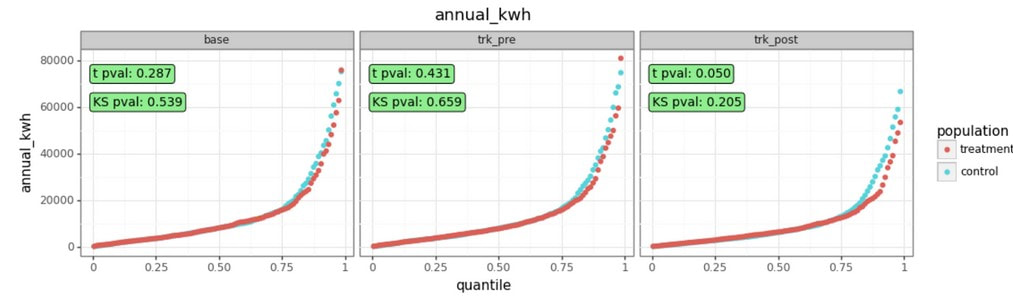
Goal: Develop and Demonstrate successful implementation of stratified sampling

  • What parameters can/should be used
  • Develop codebase and test/refine
  • Multidimensional stratification
Question: What does it take (binning schemes) to create equivalency between treatment and comparison?


Video of the July 17, 2020 Meeting: Comparison WG VIDEO - 2020-07-17

Slides from the July 17, 2020 Meeting (cumulative): Comparison WG SLIDES - 2020-07-17

Chat Record from the July 17, 2020 Meeting: Comparison WG Chat - 2020-07-17


1 Comment

comparison group principles: june 26, 2020

8/18/2020

0 Comments


why comparison groups?

  • If COVID were a time-bound, uniform event with a clear starting and stopping point, we might choose to pursue other, more familiar NRE strategies

    • Removing COVID-period meter data from consideration in modeling/estimating savings; applying a discount to savings during the COVID period; creating a model that interpolates savings for COVID period

  • Because COVID has led to non-routine changes in energy use in virtually every building in the world; because the recovery from COVID will take months, if not years - Our only choice is to track changing patterns of consumption in the population and apply those trends to our treated customers


proposed methodology to test

Picture
  1. Prior to procurement, establish program eligibility rules and apply equally to participants and non-participant comparison group

  2. Select program-appropriate parameters for establishing comparison group through stratified sampling of eligible population
  3. Sample from parameterized matrix according to distribution weights so that a comparison group of sufficient size is created that reflects anticipated program enrollments
  4. Track changes in consumption historically to establish variance
  5. Track changes in consumption going forward to determine program savings

    1. So that treated customers and non-treated customers are evaluated using the same set of baseline conditions, create monthly vintages of the comparison group that align with enrollment dates amongst treated customers


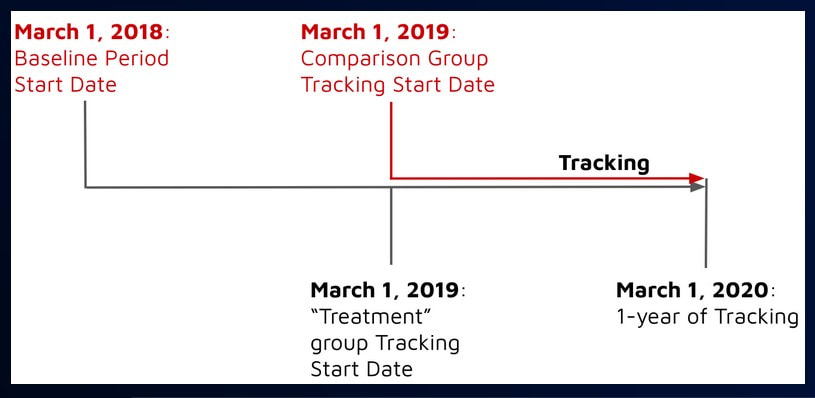
Video of the June 26, 2020 Meeting: Comparison WG VIDEO - 2020-06-26

Slides from the June 26, 2020 Meeting (cumulative): Comparison WG SLIDES - 2020-06-26

Chat Record from the June 26, 2020 Meeting: Comparison WG Chat - 2020-06-26

0 Comments

caltrack review: june 05, 2020

8/18/2020

0 Comments


key concepts regarding metered savings

Picture
  • Assumption: There is a singular event in a building that marks the beginning of a new pattern of energy consumption.
  • We want to be able to calculate the difference between this new pattern of energy use and the energy use that would have occurred if the old pattern was still in place.


  • Confusing term: baseline
    • Baseline can refer to the chronological time frame corresponding to the historical energy consumption of a building. For example, we might say “12 month baseline” and refer to the time period prior to the new pattern of energy use.
    • Baseline can also refer to the “counterfactual.” This is the estimate of how much energy would have been consumed at any given point if no changes had occurred in the building’s energy use pattern. For example, when we calculate savings, we subtract actual energy use from “baseline” energy use. In this case, we are subtracting from a calculated counterfactual rather than the actual historical consumption.
  • Confusing term: normalize

    • Statistical term versus a weather term


  • In California, the policy term of art used to describe meter-based programs is NMEC - Normalized Metered Energy Consumption.
  • Normalized (statistical)
    • Identification of a key predictive factor that correlates well with changes in energy consumption
      • Outdoor weather conditions (dry bulb temp, wet bulb temp, wind, cloud cover)
      • Indoor conditions (occupancy, production, certain end uses)
    • What is the minimum set of data that we have available across all buildings that will allow for consistent, replicable analysis?
      • Outdoor temperature (dry bulb)
      • Indoor building state (occupied/unoccupied by inference)

    • Normalization means that we use a particular set of exogenous conditions to calculate a counterfactual energy consumption value
      • E.g., When the daily average temperature is 80, this building will use 27 kWh of electricity on average.

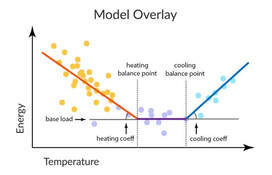
Video of the June 05, 2020 Meeting: Comparison WG VIDEO - 2020-06-05

Slides from the June 05, 2020 Meeting (cumulative): Comparison WG SLIDES - 2020-06-05

Chat Record from the June 05, 2020 Meeting: Comparison WG Chat - 2020-06-05


0 Comments

working group goals: may 22, 2020

8/18/2020

0 Comments

 
Picture
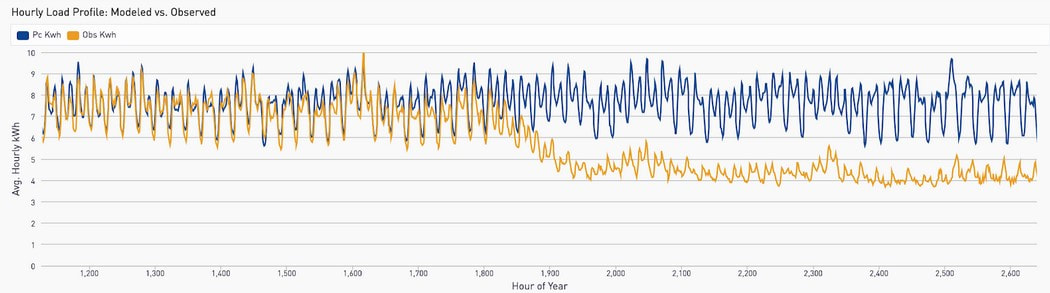
What motivates this work?

-- Overarching goal is to reduce the risk of procuring energy efficiency by using meter-based savings calculations --

Principles:

  • Data that is used must be accessible to all parties to the transaction and generally available across all transactions
  • Methods must be specified in such a way that they can be reasonably implemented in code and verified by third parties
  • Where possible, methodological debates and questions are settled through empirical testing and analysis, the results of which should be published, if possible
  • Open Source, by default.


Video of the May 22, 2020 Meeting: Comparison WG VIDEO - 2020-05-22

Slides from the May 22, 2020 Meeting: Comparison WG SLIDES - 2020-05-22

Chat Record from the May 22, 2020 Meeting: Comparison WG Chat - 2020-05-22


0 Comments

    Archives

    December 2020
    October 2020
    September 2020
    August 2020

    Categories

    All

    RSS Feed


Contact the Project Team
©2020 Recurve Analytics Inc. "Recurve" is a trademark of Recurve Analytics Inc. All rights reserved.
​Privacy Policy. Terms of Service.
Picture
  • GRIDmeter™
  • Methods
    • GRIDmeter
    • FLEXmeter
  • Code
  • Blog