 Recurve is excited to announce GRIDmeter 2.0, a major advancement toward accurately measuring the net impact of virtual power plants, demand response, energy efficiency, controllable devices, and other demand-side energy initiatives. This new version of the open-source GRIDmeter comparison methods utilizes a suite of machine learning methods, including advanced machine learning (ML) clustering algorithms, to enable significantly more robust measurement of net grid impact for portfolios and individual sites. GRIDmeter 2.0 advances the state of the art for demand side resource measurement:
Increasingly accurate and transparent measurements of virtual power plants, energy efficiency, and demand response programs are critical to enable confidence in the resources, support grid integration, and provide fair compensation. With so many factors influencing energy use, it is critical to consider the broader population alongside the changes experienced by participating customers. Was a customer saving because of more efficient lighting or because retail business slowed down? Is the response to an emergency event because of a DR program, or would it have existed anyway because people heard Flex Alerts on the radio? To these ends, comparison groups generated by GRIDmeter 1.0 have been used successfully to measure dozens of demand-side programs, including energy efficiency, demand response, electrification, and electric vehicle charge-shifting initiatives. These measurements have proven effective even in extreme situations, such as COVID-19 and intense heat waves. GRIDmeter 1.0 utilized “Individual Meter Matching,” considered an industry best practice. In this method, a comparison group is chosen from non-participants that share important categorical characteristics with a corresponding treatment group subpopulation (solar PV, climate zone, business type, etc.). With the available treatment and comparison group subpopulations in place, the individual meter matching procedure then selects the specific comparison group based on load shape similarity between each treatment meter and every possible comparison match. With the comparison group in place, changes in the comparison group are then propagated into the treatment group counterfactual to remove non-programmatic effects, yielding the net impact of the VPP or program. While GRIDmeter 1.0 has proven very successful, Recurve has continued researching and testing new approaches that take advantage of modern machine learning and computational advancements and is proud to introduce Machine Learning (ML) Clustering, which improves several key aspects of comparison group selection and performance. GRIDmeter 2.0 utilizes a suite of machine learning techniques to create “clusters” of non-participant meters with similar profiles, and each treatment meter is assigned an individualized correction based on a weighted assignment of clusters. 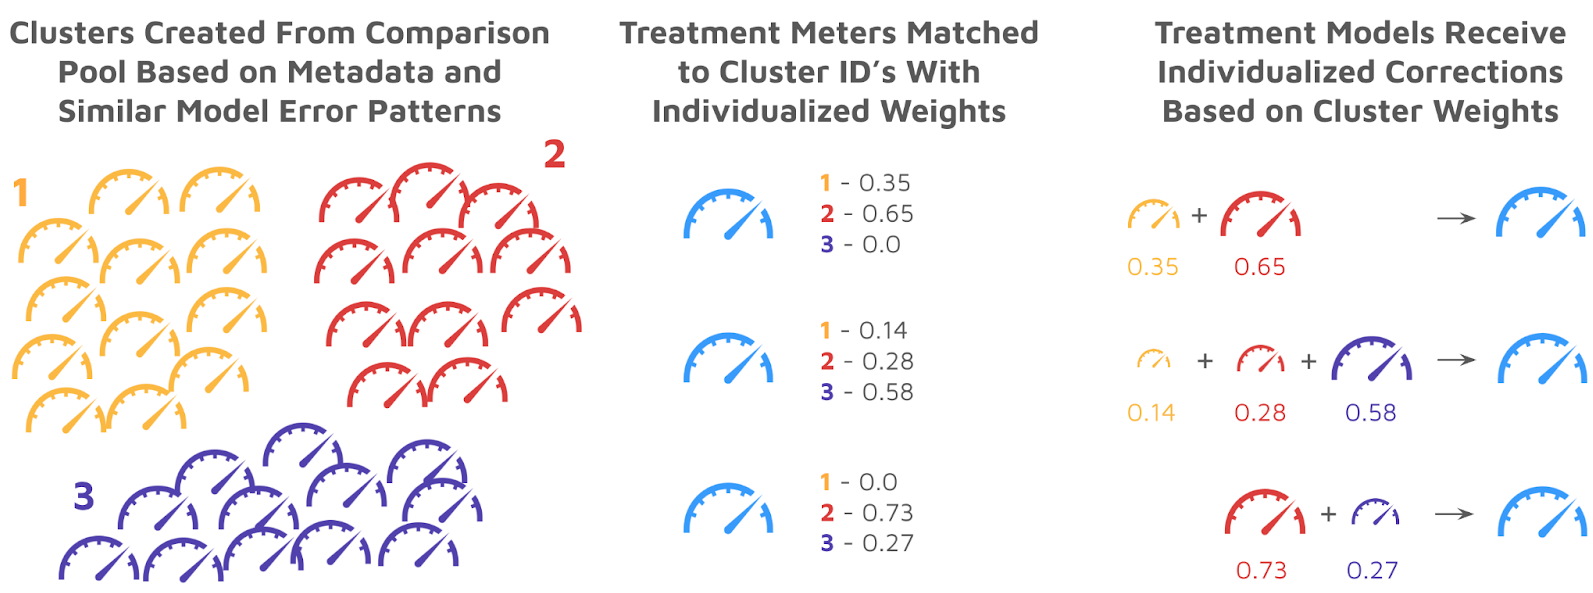 The next image gives an example of a treatment meter’s model error profile (bottom panel) and how the error patterns are matched by a weighted combination of clusters (top four panels). With the combination of clusters in place that best replicates the treatment meter’s baseline error profile, the comparison group corrections in the post-program period will have the greatest relevance. This process is done for every meter in the treatment group. 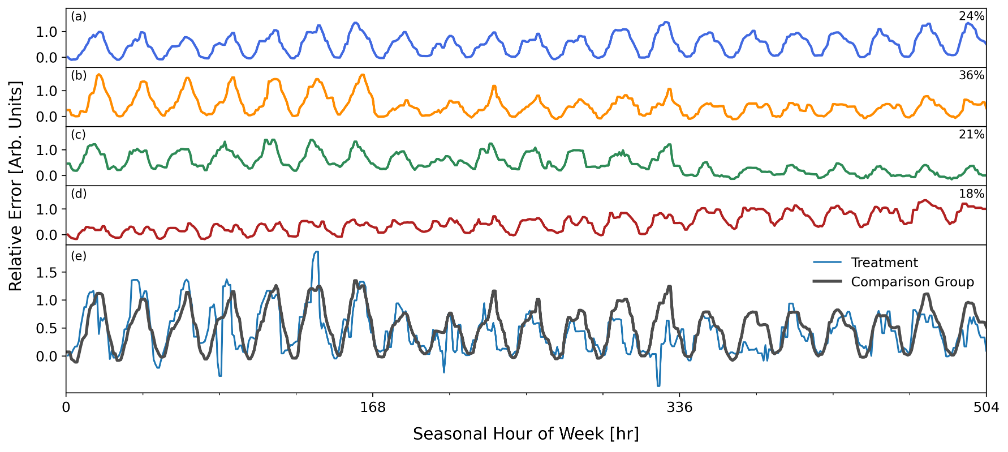 The ML Clustering approach has several key advantages:
Through extensive testing, Recurve has optimized the GRIDmeter 2.0 ML Clustering algorithms and confirmed that the methods yield more accurate results with lower uncertainty than Individual Meter Matching. Recurve has updated GRIDmeter to include ML Clustering, and these methods are now available through the open-source GRIDmeter repository. We have already used these methods to make the first successful measurement of PG&E’s Pilot Plus/Pilot Deep (a pilot building upon the Energy Savings Assistance Program), an initiative that will rely heavily upon trustworthy measurements in order to evolve and optimize both customer experiences and beneficial grid impacts. The upgraded GRIDmeter 2.0 approach will be available to all Recurve customers — and as with many approaches, ML Clustering can continue to improve as we optimize with new datasets. We look forward to deploying GRIDmeter 2.0 to enhance the quality and reliability of our measurements and serve our clients best! Contact us to learn more.
0 Comments
COVID Has Rendered Traditional M&V Obsolete. Learn how the GRIDmeter™ Can Make it Work Again.12/7/2020  Tuesday, December 8th, 2020
1:00 PM Pacific Time Who is it for? Utilities that are struggling with planning for exogenous impacts on energy consumption. Register COVID-19 has upended the energy efficiency and demand flexibility industry’s assumptions about energy use and rendered traditional Measurement and Verification (M&V) all but useless. Longer-term trends of decarbonization, electrification, and increased renewable, intermittent generation and other exogenous factors create similar challenges to understanding and valuing flexibility interventions. In this webinar, Recurve CEO Matt Golden and Director of Policy & Emerging Markets Carmen Best explain how the new GRIDmeter™ project successfully used privacy protected utility data to identify comparison groups in order to differentiate the way in which COVID impacted different kinds of commercial and residential energy consumers -- and how utilities can apply these insights immediately to understand the impacts of COVID and other exogenous factors on their own programs. Alice Havenar-Daughton of MCE will be joining the discussion to talk about the value of this analysis to the evolution of their energy programs. Register here. Recurve Final Presentation: Methods and Open-Source Code to Enable M&V in the era of COVID10/23/2020 Six months ago, with support from the Department of Energy and help from MCE and other partners, Recurve initiated a working group to develop new open source Measurement and Verification (M&V) tools for an era in which energy consumption is defined by uncertainty.
  Acknowledgments
These methods and open-source code was developed based upon funding from the U.S. Department of Energy, through the National Renewable Energy Laboratory. Recurve would also like to thank MCE for supporting this project by providing secure access to data. Finally, Recurve thanks the members of the Comparison Groups Working Group, who devoted their time and effort to listening, reviewing, and providing feedback throughout the research and development of the methods and recommendations in this report.  high-level takeaways  Comparison groups can create uncertainty for multiple reasons:
Portfolio and comparison group sizing matter. There is a very predictable uncertainty reduction as group sizes increase. what we now know 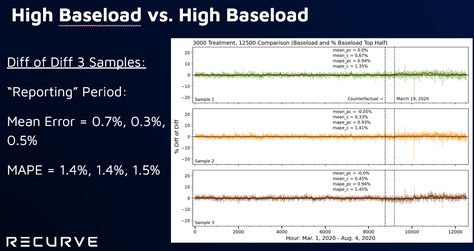 Program tracking with annual savings calculations and portfolios of 3,000+ heterogeneous buildings. Random sample of 3,000+ non-participant buildings from eligible population
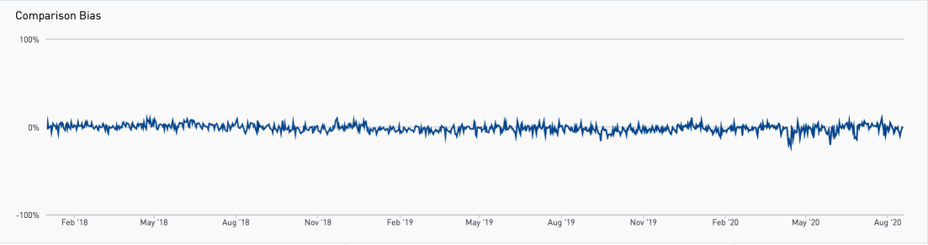
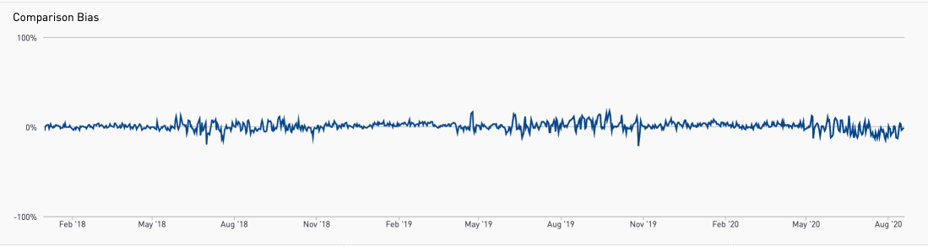
Program tracking with annual savings calculation with portfolios of 1,000+ relatively homogeneous buildings. Random sample of 3,000+ non-participants from targeted population Program tracking with marginal hourly savings calculations with smaller numbers of homogeneous buildings. Stratified sample of 3,000+ non participants from targeted population Savings reconciliation after enrollment has closed and full treatment population is known, especially needed where program enrollments are substantially different than comparison pool. Stratified sample that maximizes sample size relative to error between treated and non-treated groups  ●Would a comparison group that matches the baseline usage pattern of a treatment group start to exhibit bias over time that would negate some of the savings of the treatment group? ●We know that there might be self-selection issues that might need to be addressed during the selection of the comparison group ●But we don’t know what the variability of the bias might be and we don’t know whether or not it might get worse under conditions of large-scale energy changes, such as during COVID experiment ●Simulate the selection of treatment and comparison groups for a program ●Target a subset of high peak load users, similar to what might done for a program that is focused on peak load reduction ●Select a variety of sizes of “treatment” and “comparison” groups from the larger targeted population that can be compared against each other pure doppelganger vs two smallest groups vs two largest groups 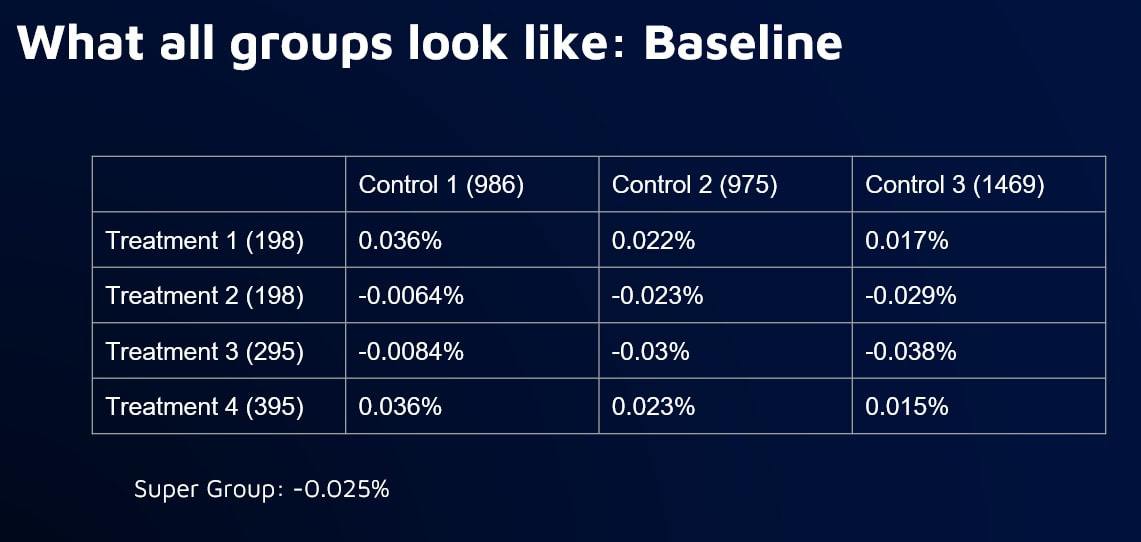 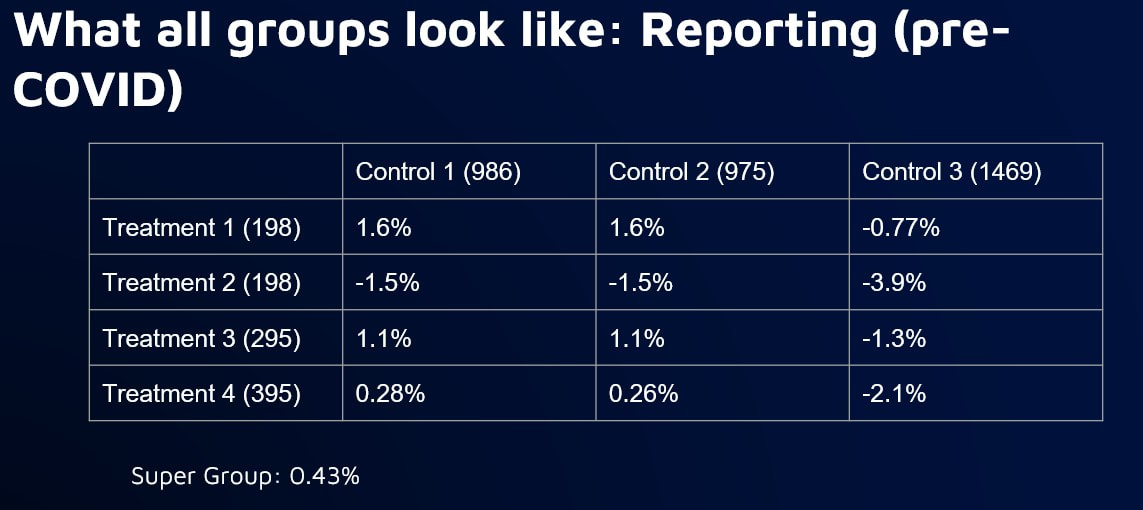 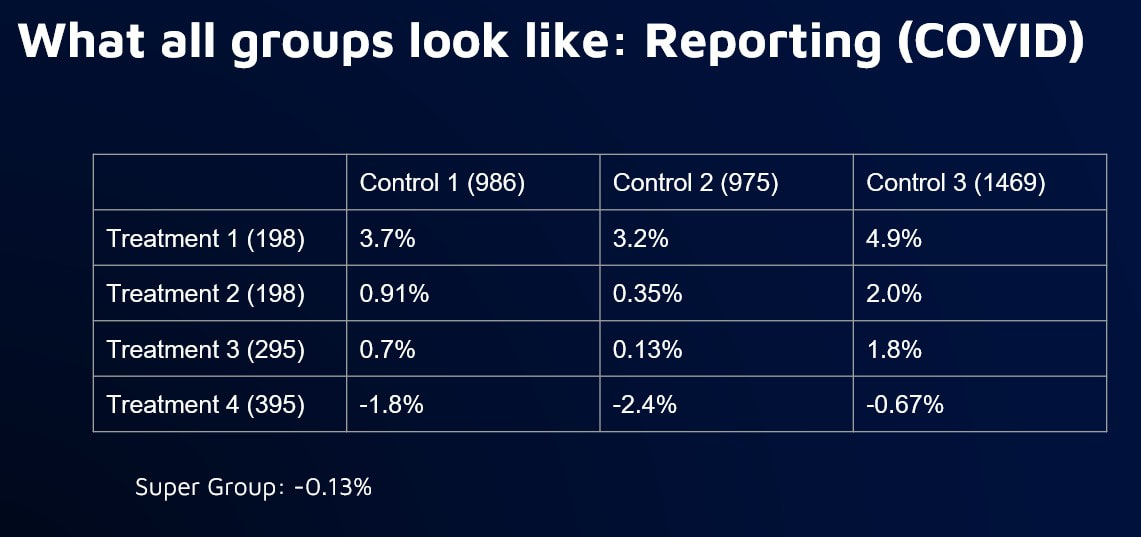 takeaways: Bias is inevitable in comparison groups due to factors beyond our ability to control for 2) Larger groups will reduce bias, but treatment group may still diverge from comparison group over time 3) Need for more systematic approach to determine optimal comparison and treatment group sizes Standardizing Stratification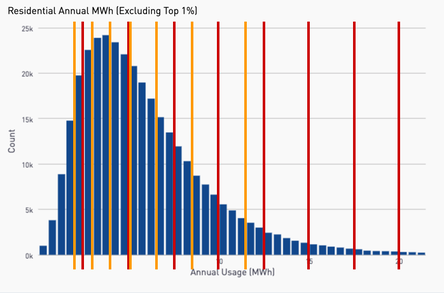 Stratification is about binning ●What parameters? ●Equal distance or population? ●How many bins? ●How many parameters? ●In what order of priority? ●Should there be an order? ●How do you gauge success? Stratified Sampling: What are the Constraints? The only option in resampling is the elimination of meters. Two main constraints: 1.The size of the comparison pool 2.The number of meters needed in the final sample 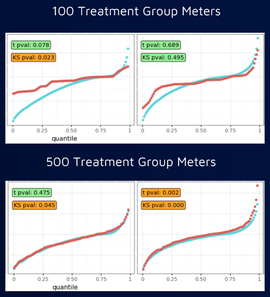 Standardizing Stratification: Dealing with Multiple Parameters
Multiple parameters can generate a more representative sample ●Complexity: Stratifying the first parameter and then moving on to the next will inherently change the first ○Solution = Simultaneous 2D or nD binning ●How should the individual parameters be prioritized and binned? ○Solution = An optimal scheme should be determined via algorithm. ●How do you gauge success? Video of the August 28, 2020 Meeting: Comparison WG VIDEO - 2020-08-28 Slides from the August 28, 2020 Meeting (cumulative): Comparison WG SLIDES - 2020-08-28 Chat Record from the August 28, 2020 Meeting: Comparison WG Chat - 2020-08-28 Without a Comparison Group Why is COVID A Problem?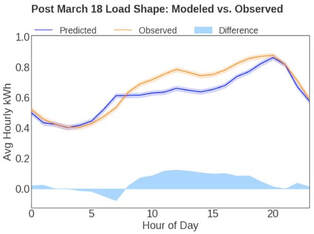 Residential Sector COVID Impacts: Blue line is CalTRACK Hourly Counterfactual. Orange line is observed usage. Without a comparison group to account for COVID, the increase in consumption wipes out program savings. Chart Shows Analysis from March 19 - May 8; 7.2% Increase in consumption due to COVID Diff-of-Diff: A (Slightly) Deeper DiveThe “Difference of Differences” Calculation
(Counterfactual_Treatment - Observed_Treatment) - (Counterfactual_Comparison - Observed_Comparison) Video of the August 14, 2020 Meeting: Comparison WG VIDEO - 2020-08-14 Slides from the August 14, 2020 Meeting (cumulative): Comparison WG SLIDES - 2020-08-14 Chat Record from the August 14, 2020 Meeting: Comparison WG Chat - 2020-08-14 concept
Stratifying a sample is done based on binning: Bins are defined based on the treatment group. The relative number of customers between treatment and comparison groups needs to match in every bin. 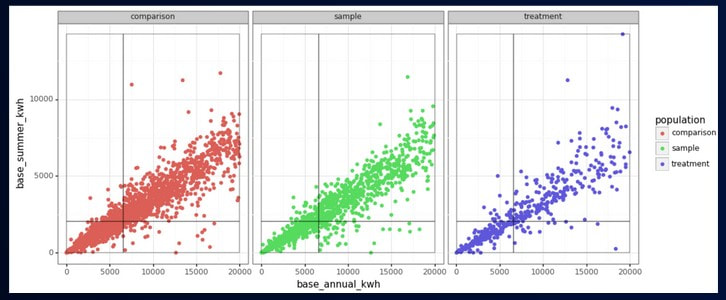 anticipated strategy For most comparison pools, stratify on up to 3 parameters
Examples of normalized electric features % Heating kWh % Baseload kWh % Summer Peak kWh Video of the July 31, 2020 Meeting: Comparison WG VIDEO - 2020-07-31 Slides from the July 31, 2020 Meeting (cumulative): Comparison WG SLIDES - 2020-07-31 Chat Record from the July 31, 2020 Meeting: Comparison WG Chat - 2020-07-31 key research strategy Create “Treatment” groups by selecting unique samples of customers Stratified sampling to produce Comparison groups Monitor divergence between “Treatment” and Comparison Groups (both pre- and post-COVID These “Treatment” groups are not program participants (which is good)! phase 1: stratified sampling and pre-covid testing 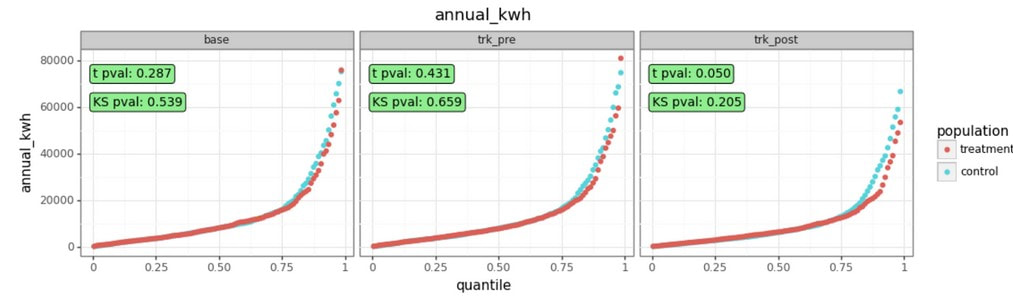 Goal: Develop and Demonstrate successful implementation of stratified sampling
Video of the July 17, 2020 Meeting: Comparison WG VIDEO - 2020-07-17 Slides from the July 17, 2020 Meeting (cumulative): Comparison WG SLIDES - 2020-07-17 Chat Record from the July 17, 2020 Meeting: Comparison WG Chat - 2020-07-17 why comparison groups?
proposed methodology to test 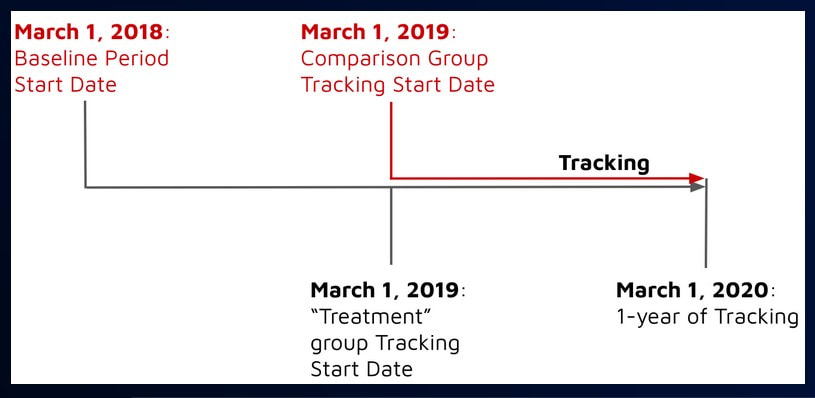
Video of the June 26, 2020 Meeting: Comparison WG VIDEO - 2020-06-26 Slides from the June 26, 2020 Meeting (cumulative): Comparison WG SLIDES - 2020-06-26 Chat Record from the June 26, 2020 Meeting: Comparison WG Chat - 2020-06-26 |
Archives
March 2024
Categories |

 RSS Feed
