 high-level takeaways 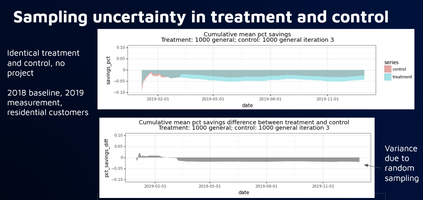 Comparison groups can create uncertainty for multiple reasons:
Portfolio and comparison group sizing matter. There is a very predictable uncertainty reduction as group sizes increase. what we now know 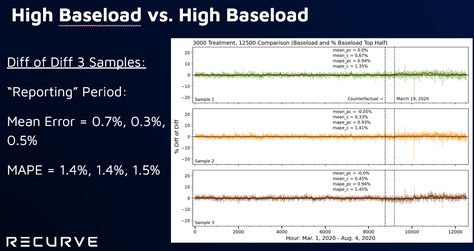 Program tracking with annual savings calculations and portfolios of 3,000+ heterogeneous buildings. Random sample of 3,000+ non-participant buildings from eligible population
Program tracking with annual savings calculation with portfolios of 1,000+ relatively homogeneous buildings. Random sample of 3,000+ non-participants from targeted population Program tracking with marginal hourly savings calculations with smaller numbers of homogeneous buildings. Stratified sample of 3,000+ non participants from targeted population Savings reconciliation after enrollment has closed and full treatment population is known, especially needed where program enrollments are substantially different than comparison pool. Stratified sample that maximizes sample size relative to error between treated and non-treated groups
1 Comment
|
Archives
March 2024
Categories |
 RSS Feed
